
A colored market indicator is only as useful as the measurements behind it. The Spanish-language community at bolsaytrading.net makes those measurements unusually easy to examine. Its public dashboard describes the funds it follows, how it groups their signals, and a limitation in its market breadth data.
From the Community Homepage to the Data
The homepage presents Bolsa y Trading as a collection of browser-based investment tools. A portrait identifies José Luis Bau as founder. In his introduction he describes himself as a computer professional and investor who built the tools around his own process. This is a first-person attribution. We did not independently verify his professional record or a company registration.
The public description sequences the tools around decisions an investor might face. The first step concerns the overall market environment, the second the rotation of money between themes. Other links lead to stock screening, options strategies, position sizing and portfolio rebalancing. The site describes community access as free and links out to a Skool community.
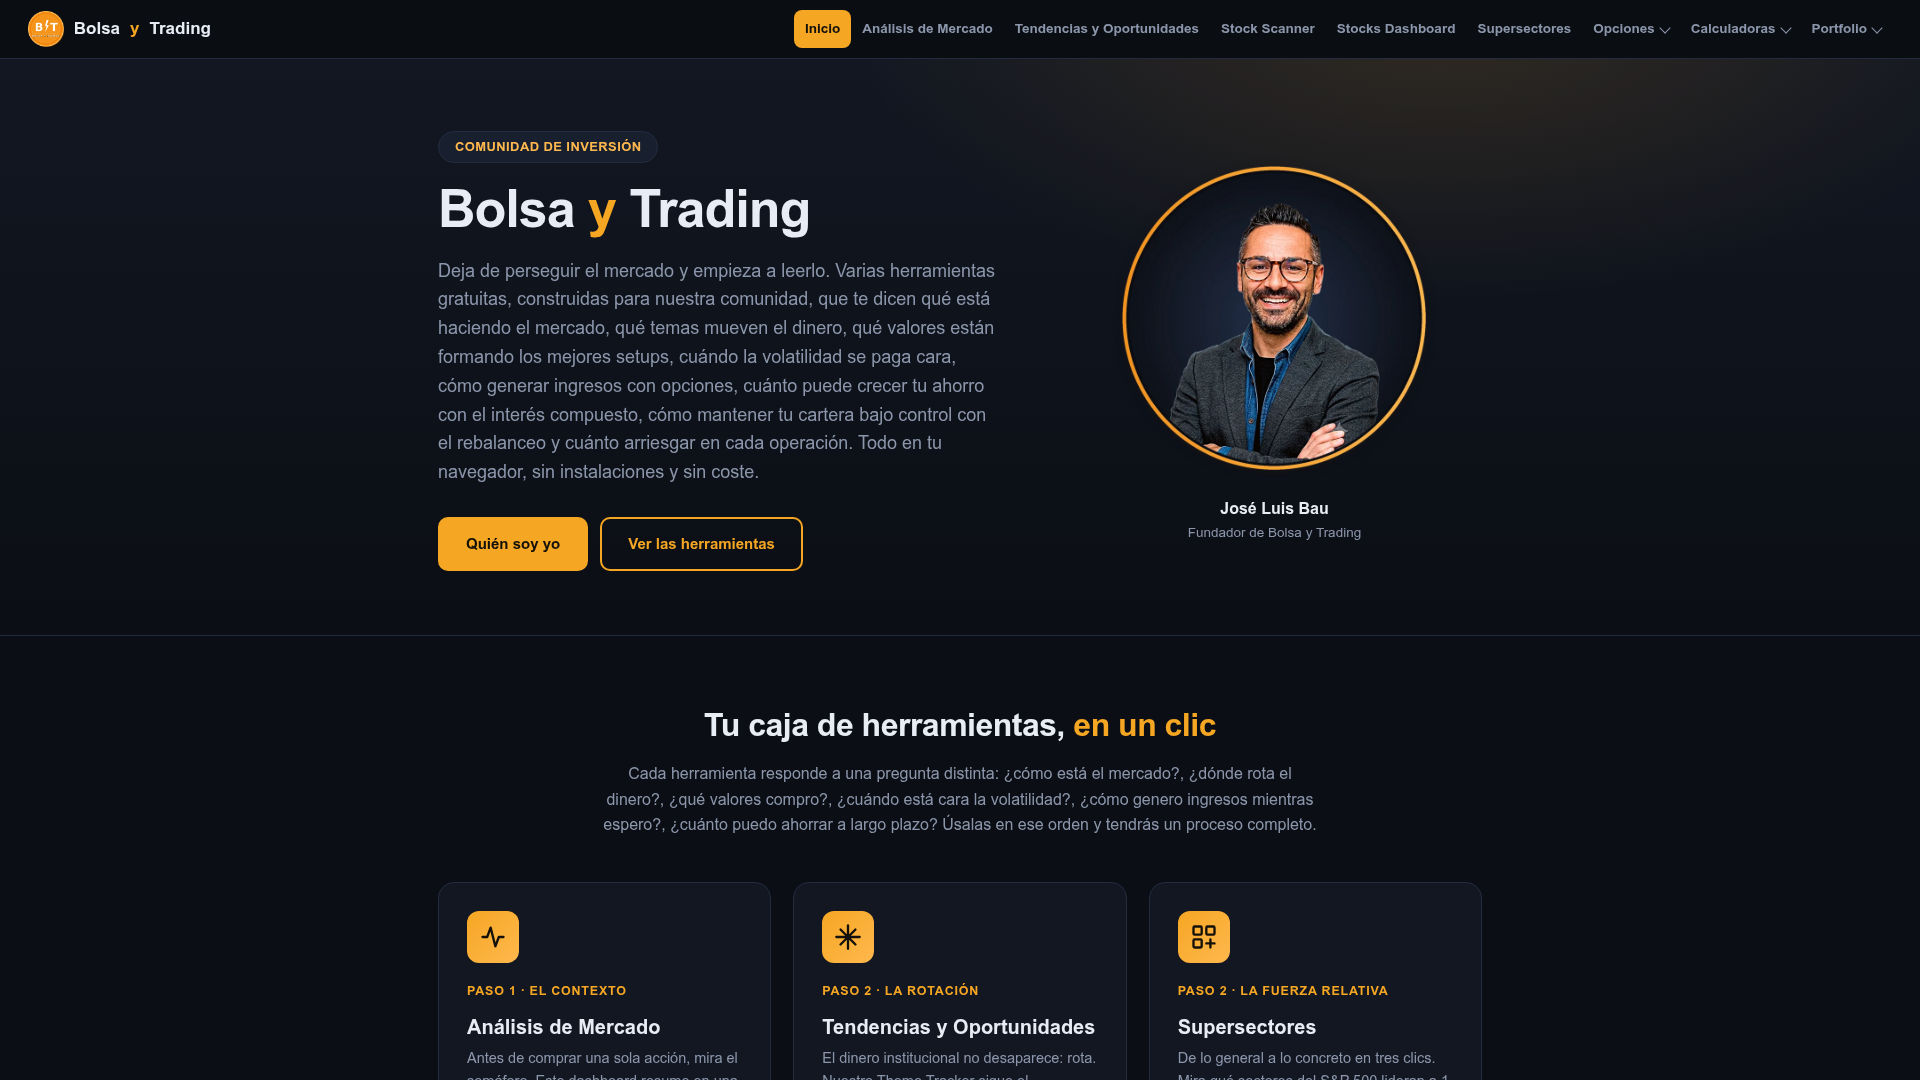
The image of bolsaytrading.net shows the introduction and a row of tool cards. It captures what was offered on the landing page. The calculations below come from the separate dashboard. Keeping those sources distinct is important because a description of live data on a homepage cannot tell a reader when individual prices were last refreshed.
What the 22 Funds Measure
The market analysis dashboard says it downloads roughly three years of daily data for 22 exchange-traded funds. It names Alpaca as the source accessed through its own proxy and Yahoo Finance as a fallback. According to the page, the first request of the day takes several seconds and subsequent loads use a cached result.
Daily observations and caching affect how to read a green or red signal. A figure visible during a trading session may reflect the most recent daily observation used in the calculation. Without its timestamp a reader cannot assume it includes the last trade. We verified the dashboard’s description and displayed figures, without independently reconstructing its price series.
The dashboard at bolsaytrading.net explicitly says it uses liquid funds as proxies because true New York Stock Exchange breadth data are unavailable through the free interfaces it describes. That disclosure matters. A fund-level comparison and a count of all advancing and declining exchange-listed securities answer different questions, even when both point in the same direction.
Why Two Green Labels Can Tell Different Stories
In the retrieved data SPY showed a closing value of $766.73, 0.04% above its 50-session average and 5.45% above its 200-session average. QQQ showed $691.68, 4.37% below its shorter average and 1.81% above its longer one. These are site-displayed observations. We did not verify executable market prices at those levels.
Someone using only the broad market label could miss that distinction. The shorter and longer comparisons for QQQ pointed in different directions, while both comparisons for SPY were positive. The point of examining the inputs is to understand the classification before using it to screen possible trades. Neither reading predicts the next closing price.
Calculators, Account Imports and Access
A portfolio dashboard advertised on bolsaytrading.net says users can import an Interactive Brokers statement and inspect margin, allocations and stress scenarios in their browser. The homepage claims those data stay local. We did not import a statement or audit the code that handles it. The site’s privacy claim is therefore distinct from our observation that it offers the feature.
The trading journal describes a different access arrangement. It invites users to record strategies and results and says that community members need an invitation code. A compound-interest calculator, meanwhile, projects a balance from assumptions.
The registry record dates bolsaytrading.net to May 1, 2026. A commercial checker gave it 22.6 out of 100. Neither source evaluates the mathematics of the dashboard. For that purpose the important checks are the selected instrument, the date of the observation and the definition of the indicator being compared.
Check the observation date before comparing any figure with a live brokerage quote.
Frequently Asked Questions
Does the Site Offer a Funded Trading Account?
The homepage advertises a challenge tracker with examples of account sizes and trading rules. A tracker can compare entered trades with a target or loss limit. We found no evidence in the reviewed pages that the tool itself supplies trading capital or guarantees admission to a funding program.
Is the Founder Identification Independently Verified?
The portrait and signed introduction establish how the publisher identifies himself. They do not establish a licensed advisory relationship, a contracting company or who administers any linked external community. We did not identify a specific regulatory determination about the reviewed address.
Conclusion and Reporting Guidance
The strongest feature we could verify at bolsaytrading.net was a dashboard that explains its use of proxies and shows the moving averages behind its classifications. Readers can check a dated example before relying on a signal. The handling of imported statements remains a separate, unresolved technical question.
If a paid offer references this free tool, retain its precise terms and the sender’s identity. InvestorWatchdog’s methodology explains how to weigh the evidence. Its reporting guide covers preserving payment and communication records if a dispute arises.